What Official UFO Investigations Found
Unidentified is a procedural data status, not a conclusion about non-human origin.
- 90% to 97% of reports resolve to known causes. Official datasets (Blue Book, AARO, GEIPAN, Hendry) prove astronomical bodies, aircraft, balloons, drones, and satellites dominate sightings.
- Venus and bright stars are the #1 trigger. Venus alone caused 35% of Blue Book alerts in Spring 1953; astronomical bodies account for 29% of all misidentifications.
- Unidentified means data deficit, not alien physics. GEIPAN separates Category C (30% lacking data) from Category D (3% unexplained despite investigation).
- Trained observers are human. Pilots suffer a 75% error rate on unfamiliar sky lights because featureless skies remove spatial distance references.
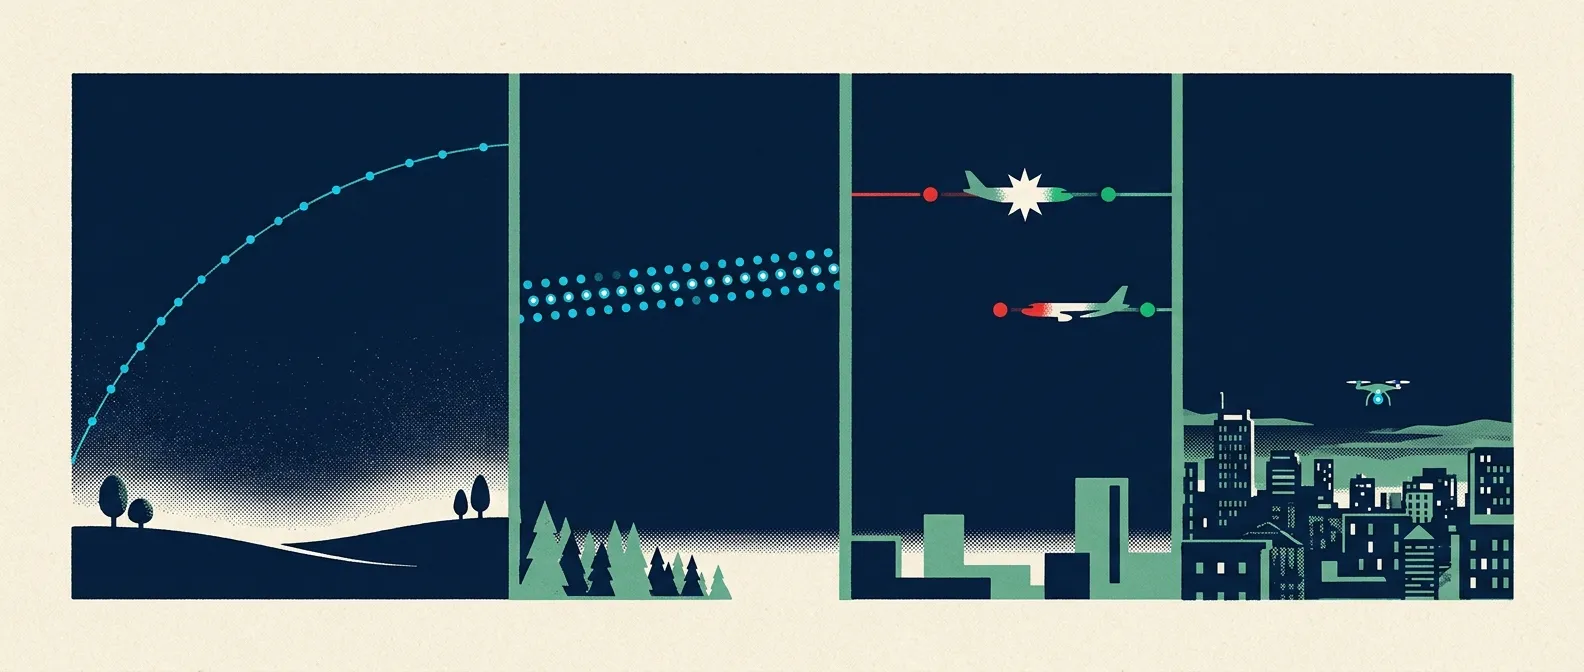
For eight decades, government programs, air forces, and scientific institutions have investigated public and military UFO and UAP reports. Across thousands of investigated cases, the base rates are consistent: 90% to 97% of reports resolve to ordinary astronomical, aeronautical, or optical causes.
Before evaluating an unexplained light, check your observation against our master sky field guide. To understand the historical statistics, pilot error rates, and official government findings, use this breakdown of US military investigations, international space agency databases, and Bayesian probability models.
US Official Programs: Project Sign to Pentagon AARO (1947–2026)
Official US government investigation began after WWII and has evolved across several military and intelligence eras:
- Project Sign (1947–1949, 243 cases) & Project Grudge (1949, 244 cases): Early USAF investigations concluded ~80% of cases were caused by conventional objects, aircraft, or mass hysteria.
- Project Blue Book (1952–1969, 12,618 cases): The USAF’s longest running program resolved 11,917 cases, leaving 701 (5.5%) unidentified. The 1953 CIA Robertson Panel and 1968 Condon Committee (1,485 pages) concluded UFOs posed no direct national security threat and recommended public education to reduce intelligence clutter.
- Modern Intelligence Programs (AATIP, UAPTF, AARO):The Pentagon’s All-domain Anomaly Resolution Office (AARO) instituted standardized scientific review:
- FY2022: 510 total holdings (195 resolved to balloons, drones, or clutter).
- FY2024: 757 cases analyzed (118 resolved + 174 queued for closure).
- FY2025: 319 new cases received and 370 total cases closed. Every closed case received a conventional explanation (satellites, balloons, birds, aircraft, drones, or launches). AARO confirmed zero evidence of extraterrestrial origin or breakthrough foreign technology.
- NASA Independent Study Team (2023): A 16-member scientific panel found no evidence linking UAPs to extraterrestrial sources and recommended multispectral sensor calibration and AI-driven data standards.
International Datasets & Taxonomies: GEIPAN, CRIDOVNI, and MoD
International space agencies and defense ministries maintain transparent, public UAP databases:
| Nation / Agency | Program & Dataset | Taxonomic Outcome Breakdown |
|---|---|---|
| France (CNES) | GEIPAN (3,257 archived cases) | Cat A (28% identified), Cat B (39% probably identified), Cat C (30% unidentified due to lack of data), Cat D (3.1% unexplained despite investigation, ~99 cases) |
| Uruguay (Air Force) | CRIDOVNI (1,500+ cases) | 3% to 4% residual unexplained cases; 96%+ resolved to conventional aircraft or atmospheric events |
| United Kingdom (MoD) | Project Condign (50,000+ pages) | Shape taxonomy: Ball (29%), Triangular (8%), ST (7.5%), Oval (3%). Attributed residual to buoyant atmospheric plasmas and meteors |
| Canada (OCSA) | Sky Canada Project (2022) | 7-point origin matrix: Airborne Clutter, Atmospheric, Human, Industry, Gov Tech, Private Tech, Other |
The comparison reveals a universal international baseline: across France, Uruguay, the UK, and the US, genuine high-consistency, high-strangeness unexplained cases (GEIPAN Category D) consistently represent only 2% to 4% of total reports.
Granular Causative Factors: Allan Hendry’s 1,307 Case Benchmark
In 1979, astronomer Allan Hendry published a landmark epidemiological investigation of 1,307 UFO reports for the Center for UFO Studies (CUFOS). Hendry found that 88.6% (1,158 cases) were clearly identified prosaic objects (IFOs), 8.6% (113 cases) were unknowns, and 2.8% were unusable.
| Specific Prosaic Cause | CUFOS Benchmark (Hendry 1,307 Cases) | Modern Pentagon AARO / GEIPAN Dominant Causes |
|---|---|---|
| Stars & Planets | 29% (Venus leading all individual causes) | Venus, Sirius, Jupiter (tracked in Cat A/B) |
| Conventional Aircraft | ~20% (including night advertising planes) | Commercial jets, radial approach landing lights |
| Meteors & Space Debris | 9% | Bolides, orbital decay re-entries |
| The Moon | 1.7% (22 cases) | Horizon moon illumination and halo optics |
| Prank & Weather Balloons | 1.9% (23 cases) | Massive modern surge; leading cause in AARO/UAPTF cases |
| Drones & Satellites | 1.8% (24 satellite cases; pre-drone era) | Dominant modern cause: Starlink flares, consumer quadcopters |
| Sensor & Optical Artifacts | ~1% (Window reflections, mirages) | Leading modern military cause: FLIR glare, parallax, rolling shutter |
| Deliberate Hoaxes | <3% (37 cases) | CGI, synthetic media, composite photo edits |
Temporal Wave Structure & Twilight Physics
Report volumes do not occur uniformly. They spike in “flaps” driven by media contagion, film releases, launch tests, and twilight optical physics:
Sociological Contagion
- Media coverage triggers “expectant attention”
- Public scans sky, reporting standard stars/planes
- Blue Book jumped from 169 (1951) to 1,501 reports in 1952
- Internet portals increase raw low-quality report submissions
Twilight Geometry Physics
- Sightings cluster heavily 30–60 min around sunset/sunrise
- Ground is dark, but high-altitude objects remain sunlit (>50 km)
- Venus reaches peak brilliancy (−4.9) during twilight
- Creates high-contrast glowing displays over dark observers
Eyewitness Reliability: Sherif Autokinetic & Aviation Illusions
A common misconception is that trained observers (pilots or police) do not make misidentifications. Allan Hendry’s data showed pilots suffered a 75% error rate when reporting UAPs, while police officers suffered a 94% error rate.
This is a mathematical base-rate effect: pilots spend thousands of hours staring at featureless open skies. Without a background reference frame (trees or buildings), human vision suffers from size-distance invariance failure—it cannot judge the true altitude, physical size, or speed of an isolated point light.
- Sherif Autokinetic Experiment (1935): Fixed point of light in a dark room. 19 solo subjects perceived a stationary light to drift 20 to 80 cm; groups of 40 formed fabricated consensus.
- Distance Estimation Failure: In 49 cases where the stimulus was proven to be Venus or a star, witnesses estimated distance at 200 feet to 125 miles—off by hundreds of thousands of miles.
- Pentagon Video Sensor Resolution:
- Navy “Go Fast” Video: Proven by trigonometric telemetry analysis (Mick West, NASA 2023 panel, AARO) to be a parallax illusion. A jet at 25,000 ft filmed a slow weather balloon at 13,000 ft drifting at 40 mph over ocean background.
- Navy “Gimbal” Video: Proven to be a mechanical IR glare rotation. The FLIR camera de-rotation mechanism rotated internal optics, making a static jet exhaust glare appear to physically rotate.
Bayesian Prior Probabilities for an Object-Identification System
To adapt this epidemiological dataset into an automated triage system, base rates must initialize Bayesian prior probabilities:
- Prosaic Object Prior: Initialized at >0.95 (reflecting GEIPAN, AARO, and CUFOS base rates).
- Non-Human Craft Prior: Initialized at ~0.00 (reflecting zero verified empirical cases).
Shannon Entropy Reduction Checklist
- Fixed Star Alignment: Does the light maintain fixed coordinates relative to background stars? (→ Astronomical body: Venus, Jupiter, or Sirius).
- Rhythmic Strobes: Does it flash in a repeating 40–100 FPM sequence? (→ Aircraft or drone navigation lights).
- Observer Motion Parallax: Does its movement mirror camera or vehicle motion? (→ Lens flare, window reflection, or parallax).
- Twilight Expansion: Is a translucent plume expanding within 60 minutes of sunset/sunrise? (→ Rocket launch exhaust or upper-stage fuel dump).
If a report passes all prosaic filters and enters the 2%–3% residual space, the system must never output “Alien”. Instead, it must trigger a “Category D Anomaly: Human-in-the-Loop Review” flag, escalating the file to human analysts for multispectral sensor cross-referencing.
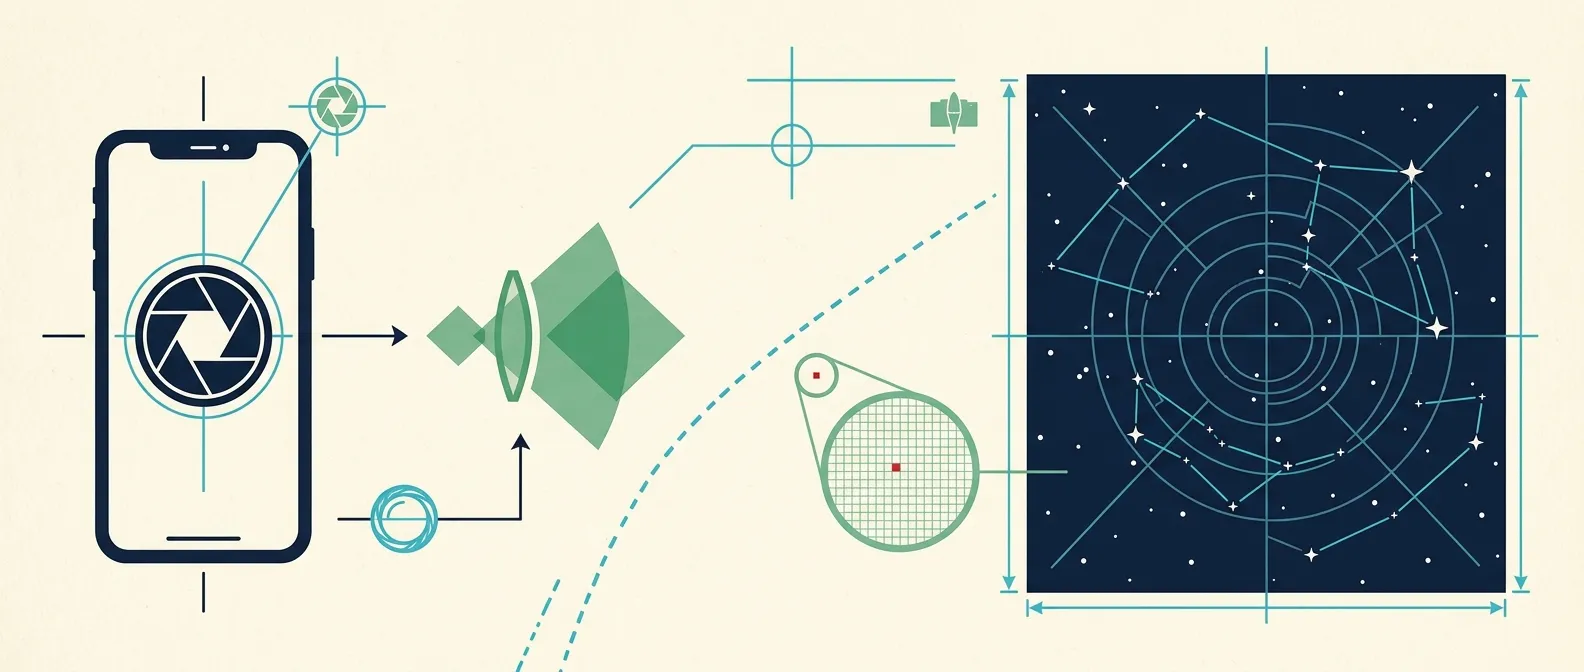
To test a night-sky photograph for lens flares, rolling shutter, or hot pixels, see our camera photo forensics guide. To check fixed or moving point lights, consult our star-versus-planet guide and moving lights guide.
For the light above you right now, open Astro and point your phone at the sky.
Open the live sky