
Mitochondria, Fat Oxidation, and Zone 2: The Cellular Engine
The microscope view of Zone 2 — and why easy pace builds an engine nothing else can.
- Zone 2 is a cellular signal, not a pace.Sustained low-intensity work activates PGC-1α, the master switch for mitochondrial biogenesis. The signal saturates at moderate calcium flux — going harder adds stress, not adaptation.
- True Zone 2 = RER ≤ 0.85, lactate < 2 mmol/L.Above that you've shifted into carbohydrate dominance and the fat-adaptation stimulus switches off. The grey zone (Z3) pays the cost of hard training for the adaptation of neither hard nor easy.
- Three clocks: hours, weeks, months.Protein synthesis spikes after a single session. Structural growth shows up at 4–8 weeks. Pace at a given heart rate improves at 8–16 weeks. Running economy compounds over years.
Zone 2 looks boring from the outside: a slow jog, heart rate below conversational speech. Inside the cell it's the opposite — a precise chemical signal assembling new power plants in your muscle fibres. The slow pace is what makes the signal clean. Push harder and the signal scrambles.
This page is the microscope view. If you want the training plan and the 80/20 dosing rules, start with the aerobic base building pillar. Here we stay inside the muscle cell.
What is a mitochondrion actually doing?
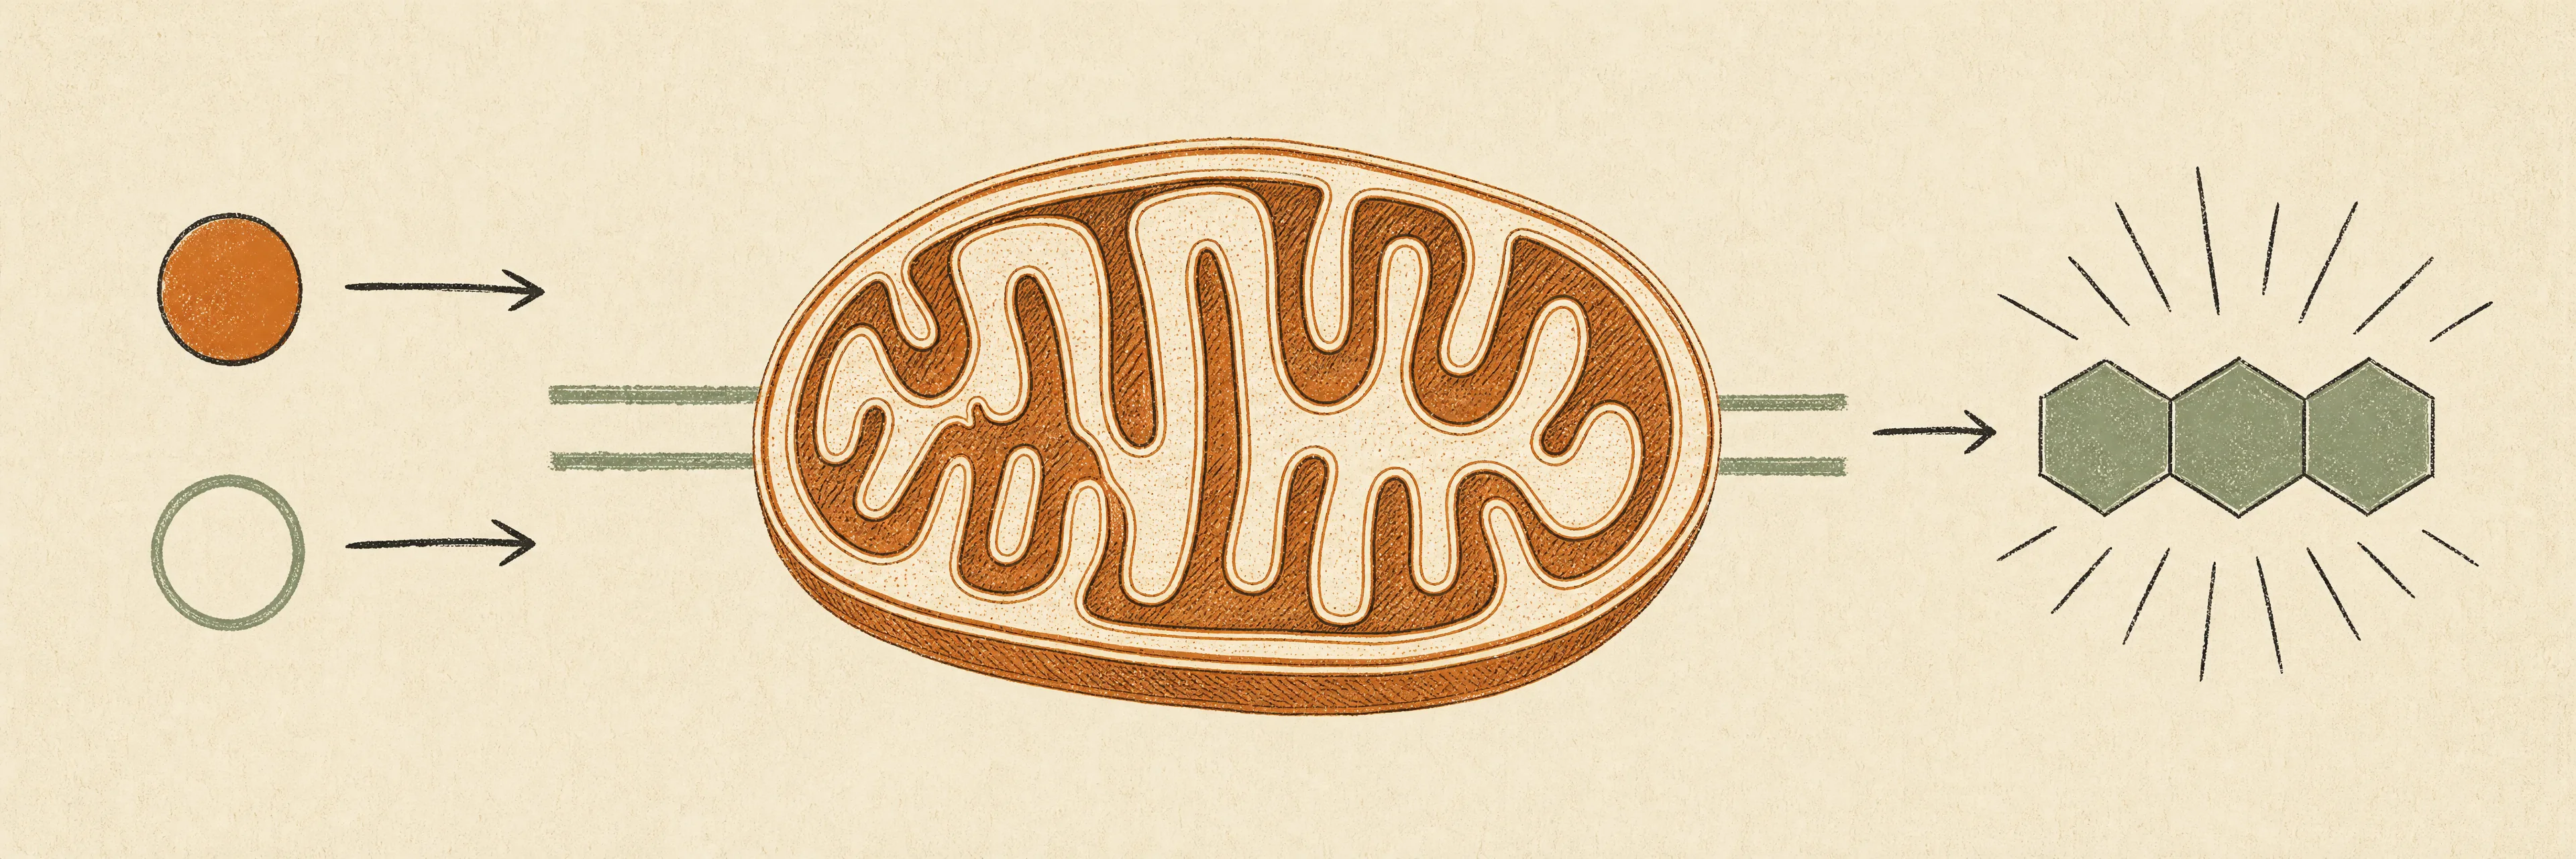
Mitochondria are the only place in the body that runs oxidative phosphorylation— the chemistry that combines oxygen with fat or glucose to make ATP, the molecule your muscle fibres spend on every stride. A single slow-twitch fibre can hold hundreds to thousands of them, packed close to capillaries so oxygen doesn't have to diffuse far.
Two enzymes do most of the measurable work: citrate synthase, which feeds fuel into the Krebs cycle, and cytochrome c oxidase, which drives the final step of the electron transport chain. Both are routinely used as biomarkers of mitochondrial content in biopsy studies — when their activity rises, mitochondrial density has risen with them.
How a Zone 2 run builds a new mitochondrion
Biogenesis isn't a single switch. It's a four-step signalling cascade that low-intensity work triggers cleanly and grey-zone work muddies.
Signal
Sustained muscle contraction at low intensity raises cytosolic calcium and tilts the AMP/ATP ratio. Calcium- calmodulin kinase and AMPK sense the shift and relay it inward.
Biogenesis
Those kinases activate PGC-1α, the master transcriptional co-activator of mitochondrial biogenesis. PGC-1α turns on dozens of nuclear and mitochondrial genes simultaneously.
Density
New mitochondria assemble and existing ones grow. Citrate synthase and cytochrome c oxidase activity climbs. A single 45–120 min Zone 2 session lifts mitochondrial protein synthesis >150% for hours afterwards.
Output
More mitochondria, packed next to more capillaries, oxidise more fat per minute and clear more lactate. Same pace, lower heart rate. Or faster pace, same heart rate.
Notice what's missing from this cascade: intensity. The PGC-1α signal (Hood et al., review) saturates at moderate calcium flux. Going harder adds catabolic stress without adding biogenesis — which is exactly why chronic tempo running (Dr Stephen Seiler's no man's land) produces fatigue without mitochondrial payoff.
Capillaries: the delivery network
Mitochondria without blood supply are useless. Zone 2 also drives angiogenesis — the formation of new capillary networks around muscle fibres — triggered by the mechanical shear stress of sustained blood flow through the smallest vessels.
A 2023 meta-analysis of muscle capillary adaptations found that moderate-intensity aerobic training alone raises the capillary-to-fibre ratio by roughly 21%. Pairing aerobic volume with occasional high-intensity intervals pushes that expansion up to 54%. The pillar has the full distance-based picture; read it here.
The crossover concept — fat versus carbohydrate
At rest you burn mostly fat. As intensity climbs, carbohydrate takes over. The crossover pointis where the two curves meet: the intensity at which you're burning a 50/50 mix. Pushing that crossover point rightward — burning fat at faster paces — is the central metabolic goal of base training.
Two things to notice on that curve. First, fat oxidation rises from rest before it peaks — easy running burns more fat than sitting still, in absolute terms. Second, the right tail of the fat curve falls sharply. Training in the grey zone (Z3) is metabolically the worst of both worlds: past FatMax, below the VO₂max threshold where intervals pay off.
Not sure whether your last run actually stayed in the fat- adaptation window? Check it with the decoupling tracker.
FatMax and why Zone 2 hits it
FatMax is the intensity at which you oxidise the most absolute grams of fat per minute. Not the highest percentage — at rest fat is nearly 100% of fuel, but the total burn rate is tiny. Somewhere in low-to-mid Zone 2, fat oxidation rate peaks: substrate flux is high, but carbohydrate hasn't taken over yet.
In lab testing, elite endurance athletes sustain 0.50–0.67 g of fat oxidation per minute at blood lactate under 1 mmol/L (San-Millán & Brooks, 2018). Recreationally active subjects shift to glycogen dominance at the same absolute workload and spike lactate well above 2 mmol/L. Same treadmill speed, two entirely different metabolisms.
That's the payoff of base training in one sentence: you move the FatMax peak to a higher absolute pace, and push the crossover behind it. The athletic consequence is glycogen sparing — you reach the finish line with fuel in the tank.
RER and lactate — how labs measure what you're burning
Respiratory exchange ratio (RER)is the cleanest non-invasive read on substrate use. It's the volume of CO₂ you exhale divided by the O₂ you inhale, measured in a mask during a metabolic test. Fat and carbohydrate oxidise with different CO₂:O₂ stoichiometry, so the ratio tells you what fuel is burning.
| RER | Fuel mix | Substrate share | Typical zone |
|---|---|---|---|
| 0.70 | ~100% fat · 0% carb | Rest / very low Z1 | |
| 0.80 | ~67% fat · 33% carb | Low Zone 2 — FatMax region | |
| 0.85 | 50% fat · 50% carb | Crossover — top of Zone 2 | |
| 0.95 | ~17% fat · 83% carb | Threshold / Z3–Z4 | |
| 1.00 | 0% fat · ~100% carb | VO₂max / Z5 |
Blood lactate is the cross-check. Fat oxidation has an inverse relationship with blood lactate — as lactate rises past the first lactate threshold (roughly 2 mmol/L), fat burning collapses. That's why "Zone 2" is sometimes defined metabolically as RER ≤ 0.85 and lactate ≤ 2 mmol/L, not as a heart-rate percentage.
The grey-zone trap — where fat adaptation dies
The single biggest mistake in base training is running slightly too hard every day. It feels productive. It's not.
True Zone 2 — fat adaptation fires
- RER 0.78–0.85, lactate under 2 mmol/L
- Full sentences, nose-breathing possible
- Calcium flux moderate, PGC-1α cleanly activated
- Mitochondria proliferate in slow-twitch fibres
Grey zone (Z3) — nothing useful happens
- RER above 0.90, lactate climbing past 2.5 mmol/L
- Carb-dominant, glycogen draining fast
- Biogenesis signal muddied by stress hormones
- Fatigue accumulates; VO₂max not stimulated either
Chronic grey-zone running is the definition of high physiological monotony. You pay the cost of hard training and get the adaptation of neither hard nor easy. Check your ego, slow down 30 seconds per mile, and let the cells work.
How fast does this actually happen?
The cellular changes run on three clocks.
- Hours. PGC-1α activation and mitochondrial protein synthesis spike after a single long easy run. Over 150% above baseline for ~24 hours.
- Weeks 4 to 8. Structural mitochondrial growth — measurable increases in organelle size and count. Citrate synthase activity climbs. Fat oxidation rate at the same absolute pace rises.
- Weeks 8 to 16. Aerobic pace at a given heart rate improves. The FatMax peak shifts rightward. Race pace feels metabolically cheaper.
Year-on-year compounding matters more than any single block. Running economy — the oxygen cost of a given pace — is the slowest adaptation of all, improving over years of accumulated volume.
Can you accelerate it?
Three nutritional and training tweaks amplify the biogenesis signal. All three work because they create local substrate stress that sharpens the AMPK / PGC-1α co-signal.
- Fasted Zone 2. 60–90 minute easy runs in a 12–14 hour fasted state. Low glycogen raises AMPK activation; refuel within an hour afterwards. Only works in base phase. Full protocol in Fasted Running and Fat Oxidation.
- Periodised carbohydrate restriction. An 8-week study of recreational male runners (Kuikman et al., 2024) found that restricting carbs during a 4-week base phase before reintroducing them lifted maximal fat oxidation and lowered O₂ cost at lactate threshold. Race-pace performance gains came from the training itself, not the diet.
- Sleep-low / train-low. Hard evening session fully fuelled; zero-carb recovery meal; sleep glycogen-depleted; easy fasted run the next morning. Controlled 3–4 week blocks only. Chronic use crashes HRV and immunity.
All three are amplifiers. None of them substitute for the raw weekly volume of easy running. The single biggest driver of mitochondrial density remains hours spent at conversational pace, week after week.
Metabolic flexibility beyond running
The same mitochondrial machinery that lets a trained runner burn fat at race pace also stabilises blood glucose at rest, improves insulin sensitivity, and lowers chronic inflammation between workouts. Metabolic flexibility is, in plain terms, the ability to change fuels without a crash.
The inflexible sedentary profile — high-carb diet + low aerobic capacity — means every two-hour gap between meals registers as low blood sugar. The flexible endurance profile runs fine on delayed meals, recovers faster between sessions, and shows the metabolic markers (low fasting insulin, low resting RER, preserved VO₂ in later life) that correlate with long healthspan. Zone 2 isn't just training — it's one of the cleanest longevity inputs we can measure.
Bottom line
Zone 2 is a signal, not a pace. The signal is clean calcium flux and elevated AMP/ATP ratio sustained for long enough to trigger PGC-1α, which assembles new mitochondria and upregulates fat-oxidation enzymes. Ten to sixteen weeks of weekly consistency shifts your FatMax rightward, pushes the crossover to a faster pace, and leaves you with more glycogen at kilometre 30 than you ever had at kilometre 20.
Go too hard and the signal scrambles. Go the right amount of easy, often enough, and the microscope tells a different story every eight weeks.