What "Seeing" Means in Astronomy and Why the Stars Shimmer
A cloudless night can still blur every planet. Fried parameter r₀, Pickering scale, mirror boundary layers, and Greenwood frequency explain the difference.
- Seeing measures angular blur in arcseconds. Values below 0.8″ represent world-class mountain peaks; typical suburban backyards range from 2.0″ to 5.0″.
- Fried parameter r₀ dictates aperture limit. When aperture D > r₀, atmospheric seeing bottlenecks resolution regardless of telescope size.
- Cooling mirror boundary layers is critical. A mirror warmer than ambient air by >1.5°F generates thermal tube currents that add 0.1″ to 0.6″ blur per °C.
- Lucky imaging freezes turbulence. Stacking the top 1% to 10% of sub-30ms short exposures improves Strehl ratio 4× to 6×.
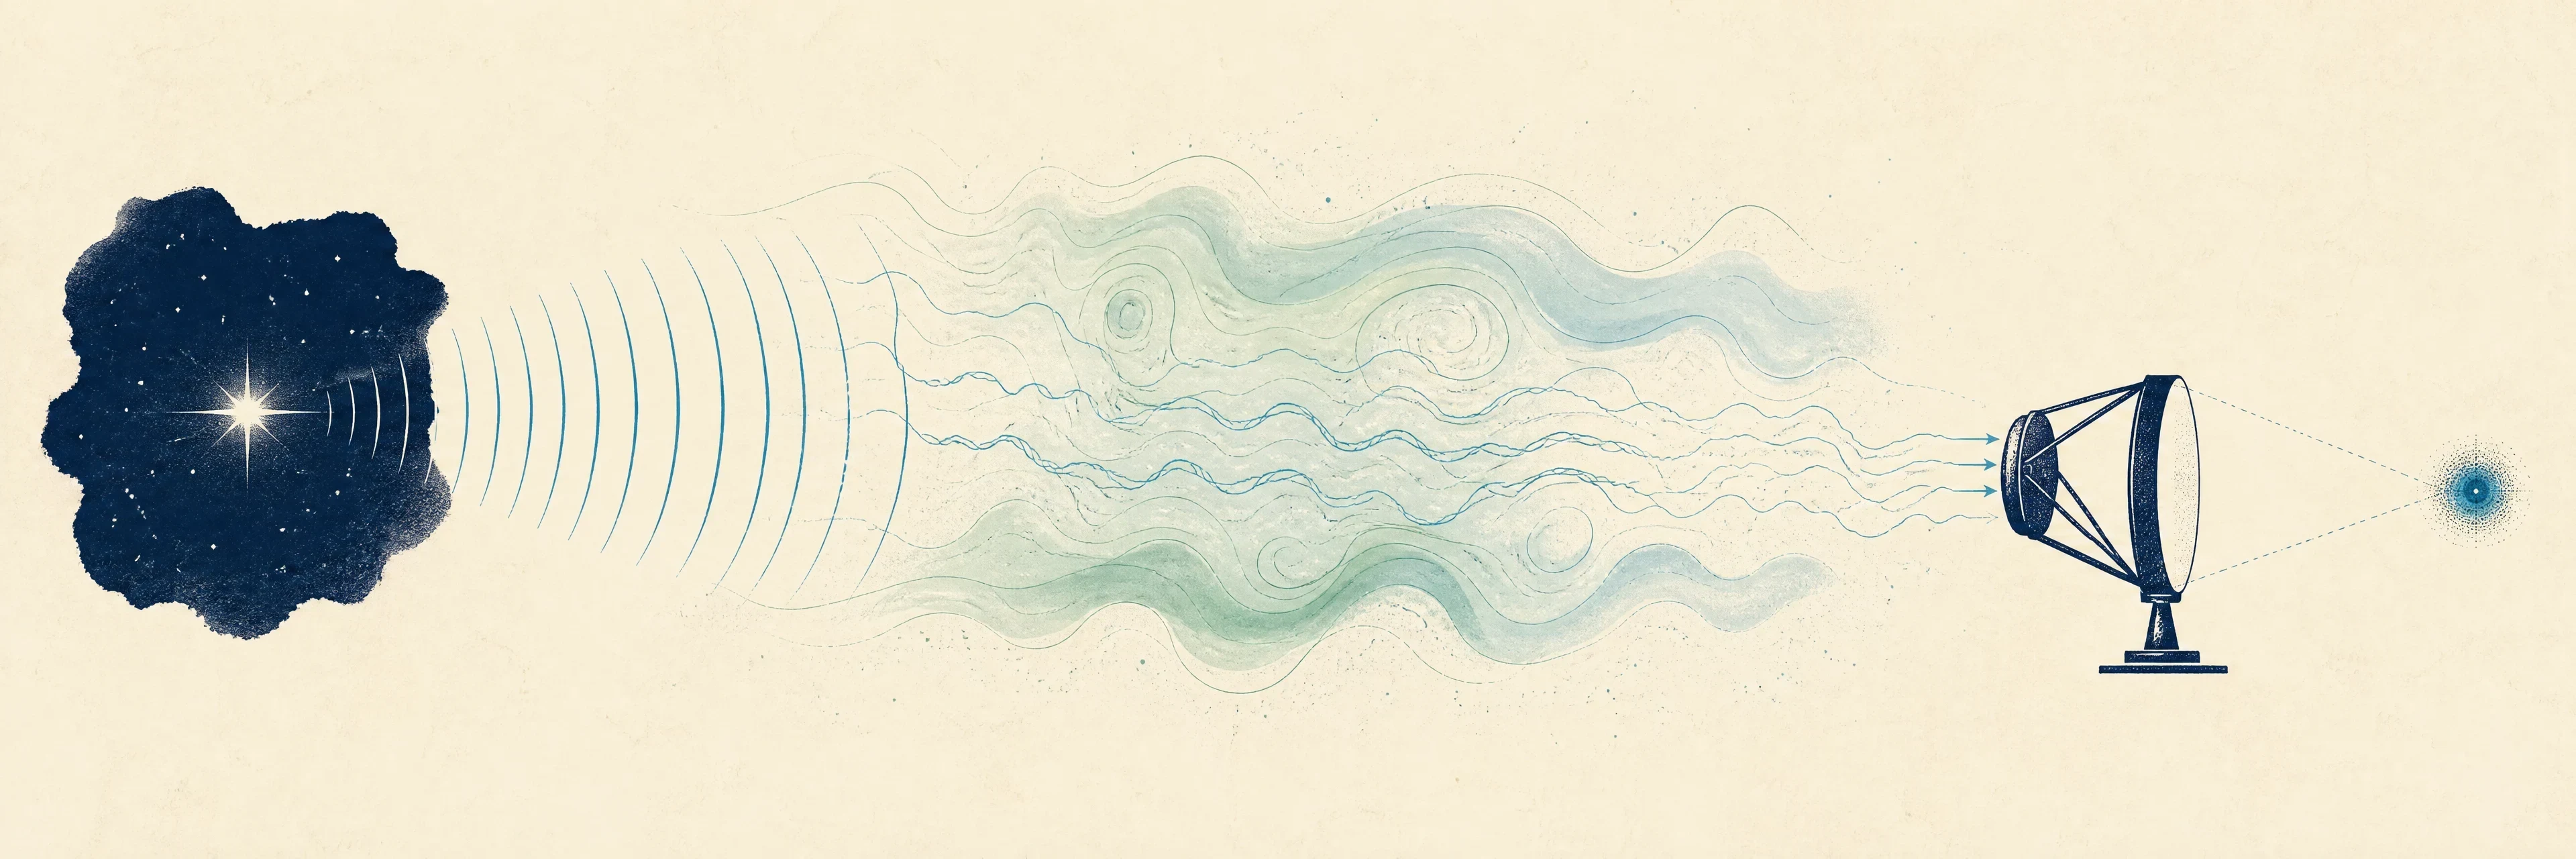
Astronomical seeing is the optical blur created when starlight traverses atmospheric turbulence with fluctuating refractive indices (Cn2). Driven by Kolmogorov energy cascades, it turns diffraction-limited point sources into bloated, boiling seeing discs measured as Full Width at Half Maximum (FWHM) in arcseconds.
How is seeing defined via the Fried parameter (r0) and Pickering scale?
The Fried parameter r0 represents the aperture diameter over which wavefront phase variance equals 1 radian. FWHM seeing disc in arcseconds is calculated as FWHM ≈ 202,140 × (λ / r0). Because r0 ∝ λ6/5, seeing improves significantly in the infrared.
| Pickering Scale (1–10) | Estimated FWHM Seeing | Visual Diffraction Pattern Appearance | Aperture & Observational Impact |
|---|---|---|---|
| Pickering 1 to 3 (Poor) | >6.7″ to 13.0″ | Star image is bloated blob, 2–3× diameter of 3rd ring; no Airy disc | High power useless; restrict to low-power wide-field deep sky |
| Pickering 4 to 5 (Fair) | 2.5″ to 5.0″ | Central Airy disc frequently visible; diffraction rings broken into arcs | Suburban median baseline; caps magnification at 150× to 200× |
| Pickering 6 to 7 (Good) | 1.0″ to 2.0″ | Airy disc clear and sharp; inner diffraction rings visible and active | Resolves planetary cloud bands, lunar craters, and close double stars |
| Pickering 8 to 10 (Perfect) | <0.4″ to 0.8″ | Airy disc razor-sharp; diffraction rings complete and stationary | World-class mountain observatory conditions; diffraction limit achieved |
Where does atmospheric turbulence live and how do major sites compare?
Optical turbulence is partitioned into three zones: the Surface/Ground Layer (0–30 m), the Planetary Boundary Layer (30 m–2 km), and the Free Atmosphere (above 2 km). At Dome C in Antarctica, 87% of all turbulence is compressed into a 30-meter ground layer; elevating a telescope above it reveals 0.23″ to 0.36″ free-atmosphere seeing.
| Observatory Site | Altitude (m) | Median DIMM Seeing | Primary Turbulence Mechanisms |
|---|---|---|---|
| Mauna Kea (Hawaii) | 4,205 m | 0.43″ to 0.65″ | High-altitude oceanic laminar flow above trade wind inversion |
| ESO Paranal (Chile) | 2,635 m | 0.66″ | Atacama Desert coastal mountain stability above marine boundary layer |
| La Palma WHT (Spain) | 2,396 m | 0.69″ to 0.80″ | Canary Islands maritime inversion; summer seeing improves to 0.64″ |
| Las Campanas GMT (Chile) | 2,380 m | 0.71″ to 0.95″ | SLODAR shows ground layer (<500 m) dominates total optical path |
| Suburban / Backyard Sites | 0–300 m | 2.0″ to 5.0″ | Thick boundary layers, roof thermal radiation, asphalt heat retention |
High-altitude jet stream winds exceeding 35 m/s at the 200–300 hPa pressure levels generate severe mechanical shear that destroys free-atmosphere seeing regardless of ground weather.
Mirror thermal management: cooldown curves and boundary layers
A primary mirror warmer than ambient air generates rising thermal plumes that degrade seeing by 0.1″ to 0.6″ per °C of temperature differential. Schlieren testing proves boundary layer heat waves form when mirror-air temperature gap exceeds 1.5°F.
Uncooled Glass Cooldown Timeline
- 0 Min (ΔT = 14°F): Severe boundary layer; wavefront error >1 wave peak-to-valley.
- 60 Min (ΔT = 5°F): Moderate boundary layer; wavefront error 0.1 to 0.5 waves.
- 90 Min (ΔT = 2°F): Near thermal equilibrium; diffraction pattern stabilizes.
Active Fan Cooling & Site Rules
- Rear exhaust/intake fans drive ΔT below 1.5°F, scrubbing boundary layer off glass face.
- Avoid setting up on asphalt or concrete; grass releases far less night heat.
- Never observe directly over rooftops, chimneys, or heat sources.
Observational limits: aperture ceiling and lucky imaging
- Aperture Ceiling in Bad Seeing: Maximum useful visual magnification is 50× per inch of aperture. In 2.0″ seeing, visual resolution peaks at a 6- to 8-inch aperture; larger apertures gather more light but yield no finer planetary detail.
- Photometric Precision Loss:Seeing FWHM fluctuations inject 7 to 15 millimagnitudes of error into bright star photometry (<16 mag) and 30 to 170 millimagnitudes into faint star measurements (>18 mag).
- Lucky Imaging Pipelines:Planetary cameras capturing high-speed video (<30 ms exposures) freeze atmospheric motion. Stacking the sharpest 1% to 10% of frames improves Strehl ratio 4× to 6×, restoring diffraction-limited detail.
- Active Tip-Tilt Correctors: Commercial tip-tilt units (Starlight Xpress SX-AO) adjust optical paths at 5 ms increments to correct fast mount gear errors and rapid tip-tilt wavefront shifts.
Primary research sources: Hufnagel-Valley Cₙ² Profile Paper, DIMM Accuracy Analysis, and ESO Paranal DIMM Climatology.
Astro matches your exact telescope aperture and target altitude to live atmospheric seeing parameters.
Open the live sky